
Updated May 6, 2026
"The Information Gain Score is the only pre-publish content metric I have ever measured that survives contact with the AI search ecosystem. The math is simple. The discipline is choosing the right embedding model and refusing to publish anything below B-."
~ Cody C. Jensen, CEO & Founder, Searchbloom


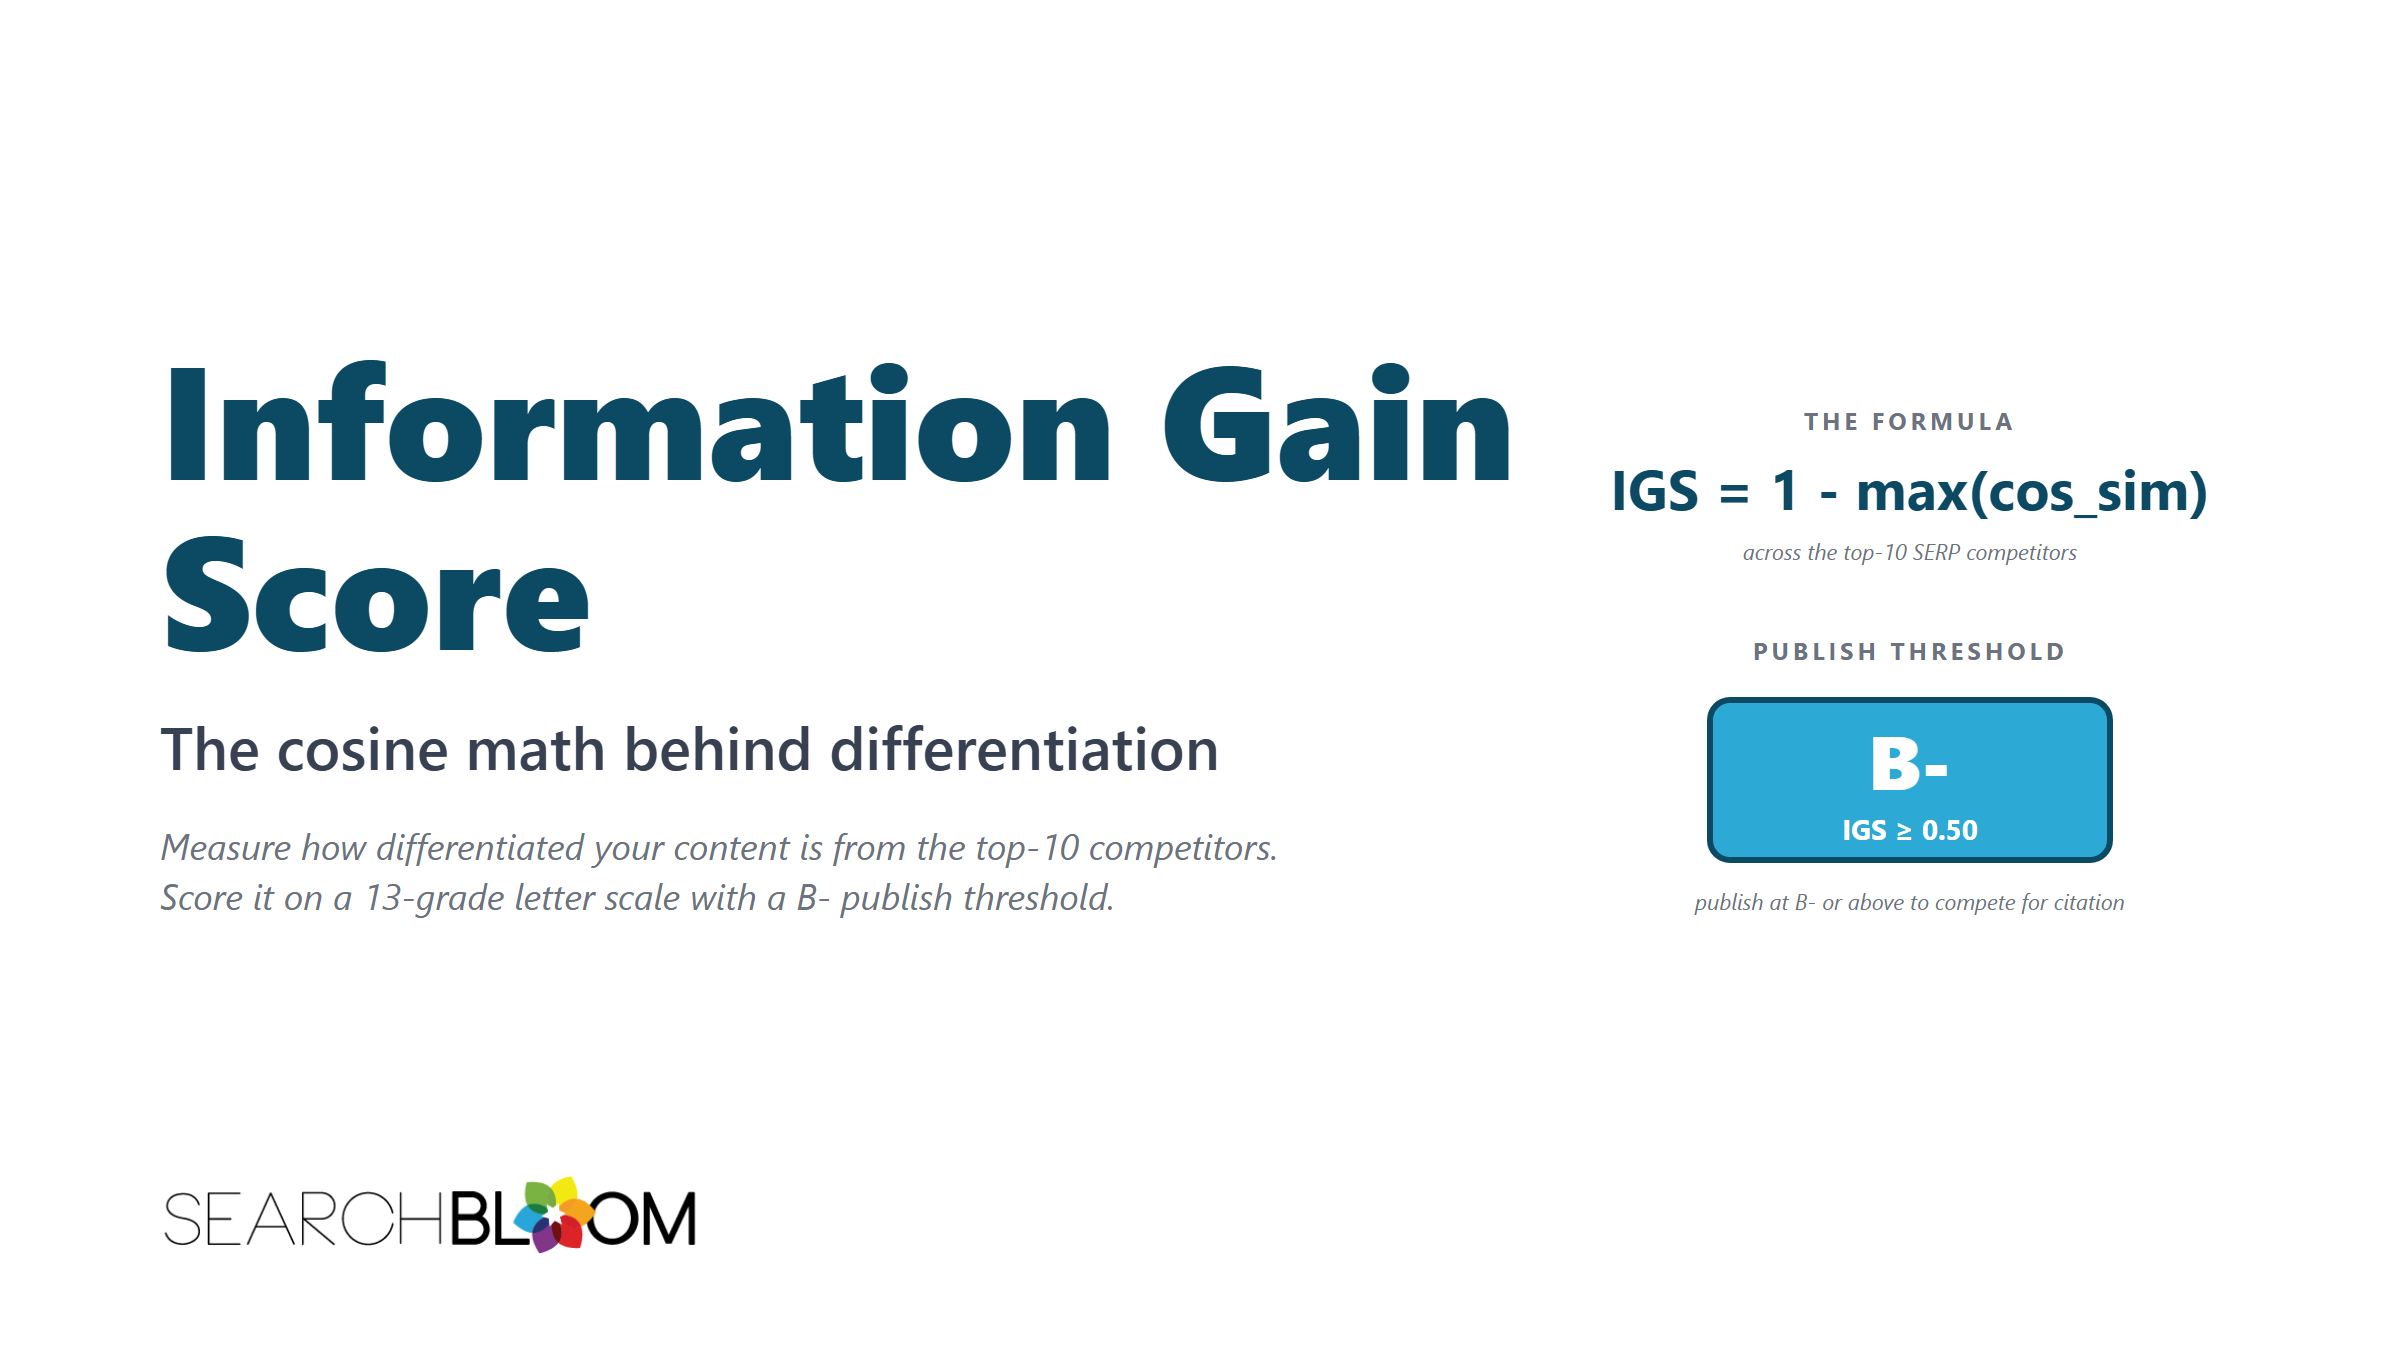
The Information Gain Score (IGS) is the math behind Information Gain Density. It collapses the question "how differentiated is this page from the existing top-ranking pages" into a single number between 0 and 1, computed at authoring time, against the actual top-10 competitors for the target query. The formula and the four-tier interpretation table are introduced in the parent article on information gain in SEO. This article is the operational deep-dive: how to actually compute the score, which embedding model to use, what the math is doing under the hood, when the score misleads, and how to use the 13-grade letter scale to make publish-or-revise decisions on real partner pages.
The formula is one line. The discipline that makes it useful is everything around it: pulling the right corpus, embedding the right segments, choosing the right model, and reading the number against the right threshold for your site's saturation level and authority profile. Most teams that adopt IGS get the formula right and the discipline wrong. This article is about the discipline.
TL;DR
- The formula is unchanged from the hub:
IGS = 1 - max(cos_sim(E(d), E(ci)))across the top N pages already ranking for your target query. What this article adds is the operational layer underneath. - The right embedding model depends on cost, dimensionality, and your team's stack.
text-embedding-3-large(OpenAI, 3072 dimensions) is the best general-purpose default.voyage-3is roughly half the cost with comparable quality.BGE-M3is free and self-hostable. Cosine similarity is dimensionality-invariant, so IGS scores are comparable across models within an order of magnitude, but the absolute numbers shift slightly between them. If the target surface is Google's AI Overviews or AI Mode, Gemini embeddings (gemini-embedding-001) and MixedBread (mxbai-embed-large-v1) are the retrieval-faithful choice, since that is the stack those surfaces run; the OpenAI and Voyage options above are model-portable defaults. - Why cosine, why max, why 1 minus. Cosine similarity ignores embedding magnitude and measures pure direction, which is what semantic comparison wants. Max (not mean) is the correct aggregator because the question is whether any existing top-ranked page is too similar; one near-duplicate competitor sinks your citation odds even if the other nine are different. Subtracting from 1 inverts the scale so higher is better, matching reader intuition about "more differentiated."
- The 13-grade letter scale runs F to A+. The practical citation threshold is B- (IGS 0.50). Reliable citation wins start at A- (0.65). The A+ tier (0.85+) carries a real risk of breaking topical relevance through over-novelty.
- Calibration depends on saturation and authority. A high-authority site can win citation slots on a 0.50 score because the conventional ranking signals carry. A low-authority site needs 0.65+ to compete. A heavily saturated topic needs the full A- to A range; a sparsely covered topic can earn citation at C+.
- Five named edge cases where IGS misleads. Short-form content, multi-language pages, novel-but-irrelevant content, AI-generated competitor corpus, and schema-heavy pages where the embedding misses the meaning. Each has a known fix.
- Tracking IGS over time matters. Competitors update their pages. The saturation set drifts. Quarterly re-scoring on priority pages catches the drift before it costs citations.
The Formula in Plain English (Again, Briefly)
The hub article walks through the formula in detail. The fast recap, since this article assumes you have read it:
IGS = 1 - max(cos_sim(E(d), E(ci)))E(d) = the vector embedding of your document.
E(ci) = the vector embedding of competing document i in the top N pages already ranking for your target query.
cos_sim = cosine similarity, the standard math for comparing embeddings.
You take the top 10 pages already ranking for your target query. You convert each to its vector embedding. You convert your own page the same way. You find the closest match (the existing page yours is most similar to). You subtract that similarity from 1. The number you are left with is your Information Gain Score.
Everything below is the operational layer underneath that one paragraph.
Why Cosine, Why Max, Why 1 Minus
The three design choices in the formula each reflect a specific decision about what is being measured. Understanding them is the difference between using IGS as a number and understanding why the number behaves the way it does.
Why Cosine Similarity, Not Euclidean Distance
Cosine similarity measures the angle between two vectors. Euclidean distance measures the straight-line distance between their endpoints. For semantic comparison of text embeddings, cosine is the right choice for two reasons.
First, embeddings are normalized in most modern models, which makes magnitude meaningless. Two documents about identical topics can have different embedding magnitudes simply because of length, vocabulary frequency, or training-time artifacts that have nothing to do with semantic similarity. Cosine ignores magnitude and measures pure direction, which is what semantic comparison wants.
Second, the embedding spaces produced by transformer-based models are dense and high-dimensional (768 to 3,072 dimensions in current production models). In high-dimensional spaces, Euclidean distance loses discriminative power because the variance between distances flattens. Cosine similarity stays meaningful at any dimensionality, which is why it is the standard choice across information retrieval, RAG systems, and the embedding APIs of every major LLM provider.
The IGS formula uses cosine similarity because Third-party RAG systems use cosine similarity. The score predicts what those retrieval layers do at query time. Google's AI Overviews and AI Mode are not a raw embedding contest; Google states they run on its core Search ranking and quality systems and its spam policies apply to AI responses, so for Google this is SEO and content quality.
Why Max, Not Mean
The aggregator across the top N competitors matters more than most teams realize. The formula uses max, not mean, because the question IGS is answering is "is any existing top-ranked page too similar to mine to be retrievable as a distinct alternative?" One near-duplicate competitor sinks your citation odds even if the other nine are very different. The mean would smooth that signal out and give a falsely high score.
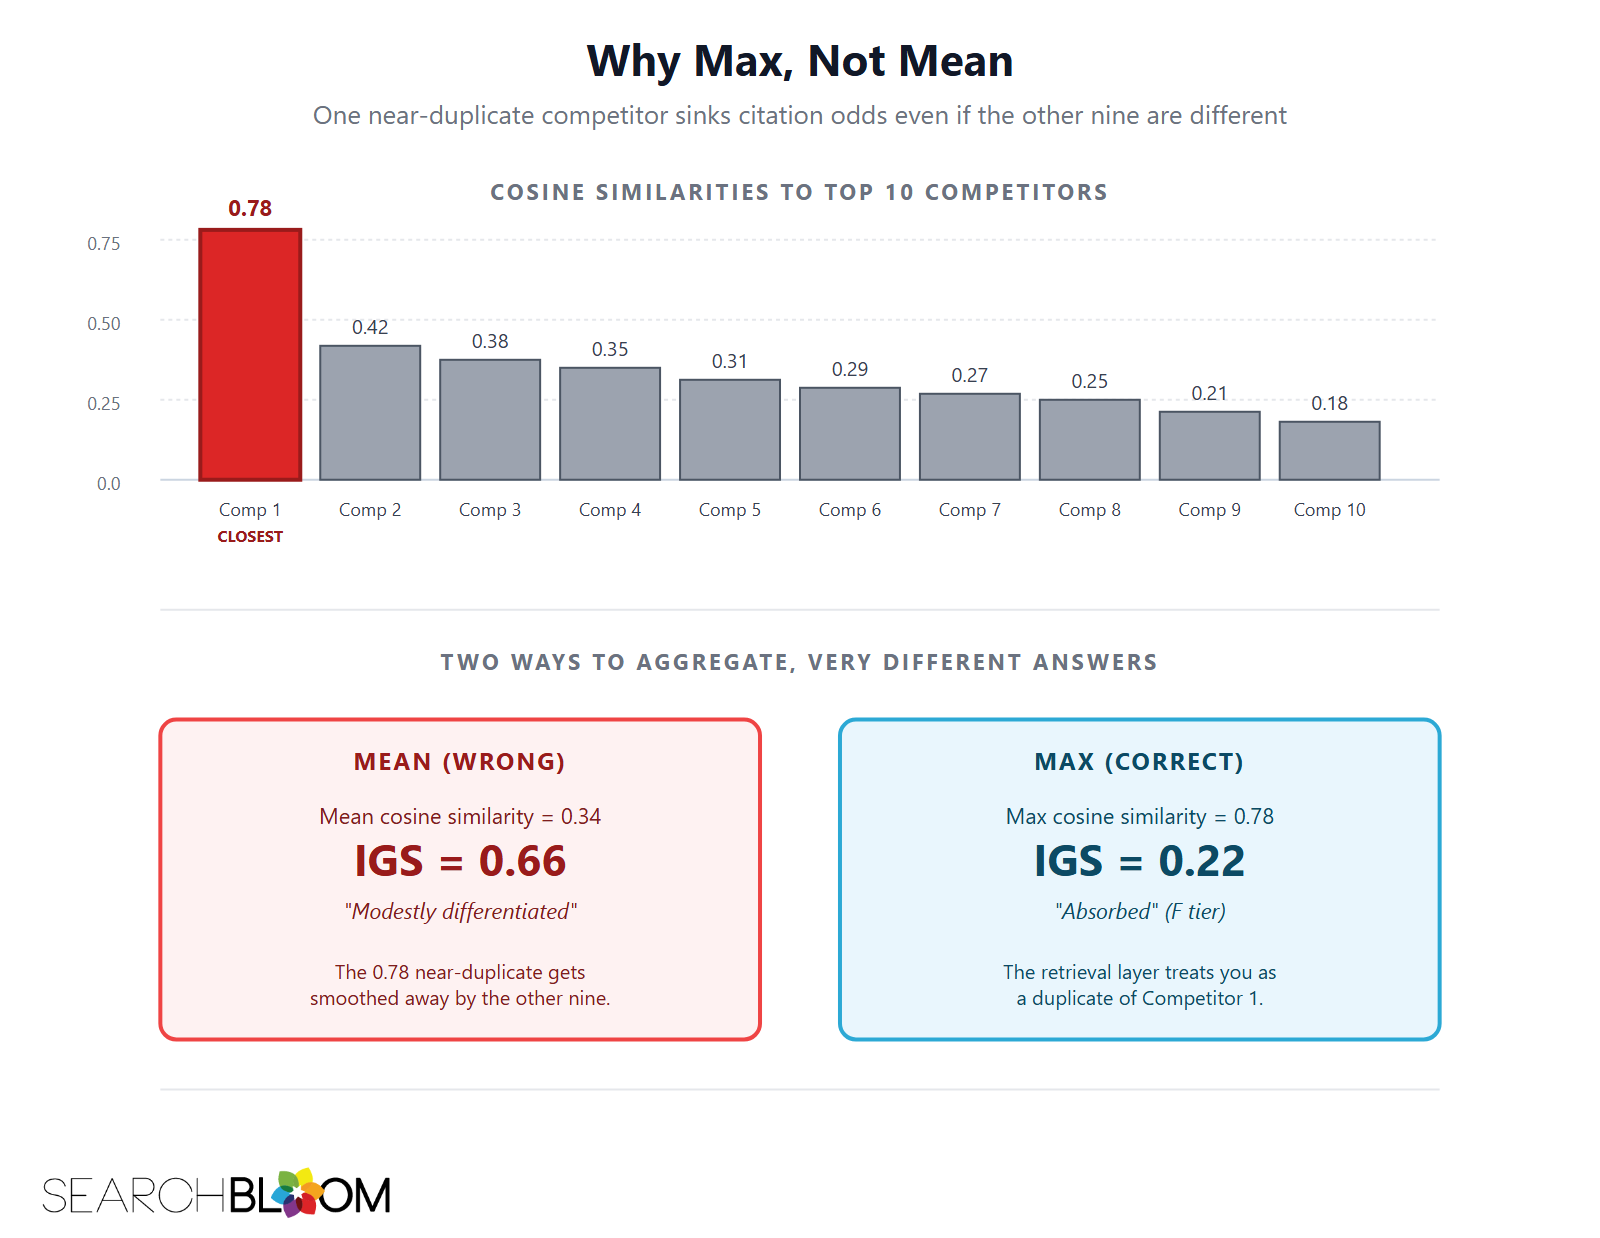
Worked example. Suppose your page's embedding has these cosine similarities to the top 10 competitors: 0.78, 0.42, 0.38, 0.35, 0.31, 0.29, 0.27, 0.25, 0.21, 0.18. The mean is 0.34, which would translate to a "modestly differentiated" mean-IGS of 0.66. The max is 0.78, which translates to a max-IGS of 0.22, which falls in the absorbed tier. The two interpretations contradict each other, and the max is correct: a competitor at 0.78 cosine similarity is functionally a near-duplicate, and the retrieval layer will pick whichever of you and that competitor has higher conventional ranking signals. The other nine competitors do not save you.
The intuition is asymmetric: similarity to even one strong competitor breaks your differentiation, while differentiation from one weak competitor does not save it. Max captures that asymmetry. Mean does not.
Why 1 Minus
Subtracting from 1 is a presentation choice rather than a mathematical one. Cosine similarity runs from -1 to 1, with 1 meaning identical direction and 0 meaning orthogonal. For documents in modern embedding spaces, cosine similarity is almost always between 0 and 1 (negative values are extremely rare for natural-language documents because their embeddings rarely point in opposite directions). Inverting the scale to 1 - cos_sim flips it so higher numbers mean more differentiation, which matches how readers interpret words like "score" and "grade." It also makes the interpretation tiers easier to remember (above 0.5 is meaningful; above 0.7 is substantial) without requiring readers to internalize "lower is better."
There is no mathematical reason the formula could not be stated as raw cosine similarity with reversed thresholds. The 1-minus framing is for human readability.
Choosing an Embedding Model
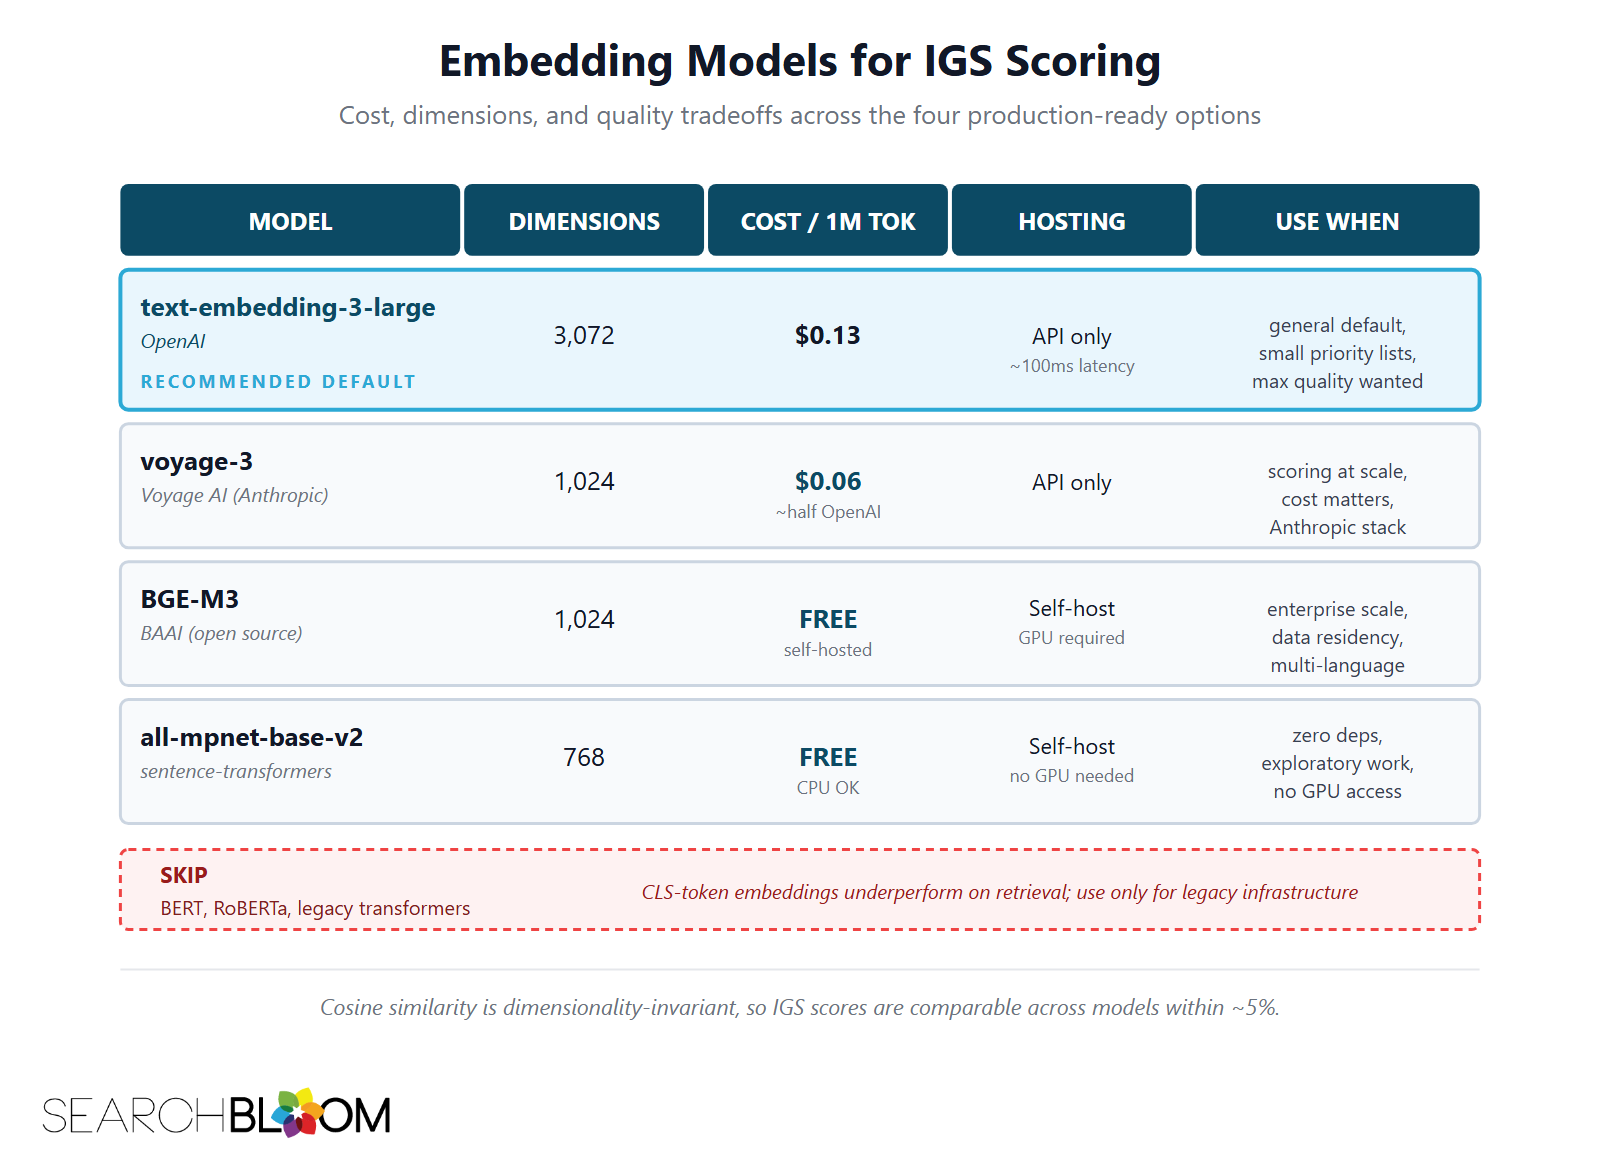
The single biggest decision in operationalizing IGS is which embedding model to use. The choice affects cost, latency, dimensionality, and (modestly) the absolute IGS values you get. Cosine similarity is dimensionality-invariant in principle, so scores from different models are comparable within an order of magnitude, but the absolute numbers shift slightly. The five models worth considering as of mid-2026.
OpenAI: text-embedding-3-large
The general-purpose default for most teams. 3,072 dimensions, $0.13 per 1M input tokens (as of Q2 2026), accessible via the OpenAI Embeddings API in any language with three lines of code. The quality is the highest of any commercially available embedding model on the standard MTEB benchmarks for retrieval, semantic similarity, and clustering tasks. The latency is roughly 100ms per request from a US-based caller.
When to use it: if your team is already on OpenAI's stack, if you need maximum quality for a small priority page list (under 200 pages), or if you do not want to think about embedding model choice and just want a default that works.
When to skip it: if cost is a concern at scale (1,000+ pages re-scored quarterly), if data residency requirements forbid sending content to OpenAI, or if you are running on infrastructure that does not have outbound API access.
Voyage AI: voyage-3
A direct competitor to OpenAI's embedding models, optimized specifically for retrieval and RAG use cases. 1,024 dimensions, $0.06 per 1M input tokens (roughly half OpenAI's price), with comparable retrieval quality on MTEB. Voyage publishes specialized variants (voyage-3-lite for speed, voyage-3-large for quality) but voyage-3 hits the right balance for IGS scoring.
When to use it: if you are scoring at scale and cost matters, if you are already on Anthropic's stack (Voyage was acquired by Anthropic in early 2025 and integrates cleanly with Claude-based workflows), or if you need slightly faster latency than OpenAI provides.
When to skip it: if your stack is fully on OpenAI and you do not want to add a second embedding provider, or if you need the absolute highest quality on edge-case content (long technical documents, multi-language) where OpenAI still leads marginally.
BAAI: BGE-M3
The leading open-source embedding model. 1,024 dimensions, free to run if you have GPU infrastructure (or a Modal/Replicate-style serverless GPU runtime for ~$0.01 per 1,000 requests). Quality is within 5% of OpenAI on MTEB retrieval tasks, and the model supports 100+ languages natively. Self-hosting eliminates per-token costs entirely and removes data residency concerns.
When to use it: if you are running enterprise-scale scoring (10,000+ pages), if data residency is a hard requirement, if you have an in-house ML team that can run a Modal or Replicate inference endpoint, or if your priority pages are multi-language.
When to skip it: if you do not have ML infrastructure to operate it and do not want to manage a serverless GPU pipeline, or if you need bleeding-edge English-only quality where OpenAI's text-embedding-3-large still wins.
Sentence-Transformers (all-mpnet-base-v2 and family)
The HuggingFace-native, fully self-hostable, runs-on-CPU option. 768 dimensions, free to run on commodity hardware (no GPU required for the smaller variants). Quality is roughly 10-15% below OpenAI on MTEB but adequate for IGS scoring on most English content. The library makes integration into a Python content workflow trivially easy.
When to use it: if you want zero external dependencies, if you are doing exploratory or one-off scoring, or if your IGS workflow runs on a machine without GPU access.
When to skip it: if you need to score at scale with consistent quality (the mpnet-base model is noticeably weaker on long-form content), or if your priority pages are multi-language.
BERT and Pre-Transformer Models
Skip these for IGS scoring. BERT, RoBERTa, and earlier transformer models were trained as masked language models, not as embedding models. The CLS-token embeddings they produce are not optimized for semantic similarity and have been measurably outperformed on retrieval tasks by every model in the four classes above. The only reason to use a pre-2023 transformer for embeddings is if you are integrating with legacy infrastructure that requires it.
The Practical Default
For most Searchbloom partner engagements, we use text-embedding-3-large for the priority page list (typically 30 to 100 pages per engagement) and re-score quarterly. The cost works out to roughly $5 to $20 per quarter per partner, which is small enough not to matter. For partners with 1,000+ priority pages or multi-language sites, we switch to voyage-3 or self-hosted BGE-M3 depending on the data residency profile. The default is what 80% of teams should use; the alternatives matter for the remaining 20%.
How to Actually Compute IGS
The operational walkthrough. Three approaches, ordered by technical lift.
Approach 1: The Spreadsheet Method (No Code)
Cosine similarity is computable in a spreadsheet, and so is IGS. The catch is that you still need someone to produce the embeddings. The cleanest division of labor: someone with API access (or Cursor / Claude Code / a notebook) generates the embeddings for the page and the top 10 competitors and pastes them into a Google Sheet. The cosine similarity formulas and the IGS calculation live in the sheet itself.
The formulas you need:
- Dot product for two embeddings A and B:
=SUMPRODUCT(A:A, B:B) - Magnitude of an embedding A:
=SQRT(SUMPRODUCT(A:A, A:A)) - Cosine similarity:
=SUMPRODUCT(A:A, B:B) / (SQRT(SUMPRODUCT(A:A, A:A)) * SQRT(SUMPRODUCT(B:B, B:B))) - IGS:
=1 - MAX(cosine_sim_competitor_1, cosine_sim_competitor_2, ..., cosine_sim_competitor_10)
The advantage: no code, no infrastructure, runs in any spreadsheet your editorial team already has open. The disadvantage: producing the embeddings still requires either someone running an API call or a no-code automation step. For teams that score five priority pages a quarter, the spreadsheet works. For anything beyond that, automate.
Approach 2: The Python Script (10 Lines)
For teams with one technical person on the content side, a Python script is faster than the spreadsheet and easier to repeat. The minimal version, using the OpenAI embeddings API:
from openai import OpenAI
import numpy as np

oai = OpenAI()

def embed(text):
    return np.array(oai.embeddings.create(
        model="text-embedding-3-large",
        input=text
    ).data[0].embedding)

def cosine(a, b):
    return np.dot(a, b) / (np.linalg.norm(a) * np.linalg.norm(b))

your_page = embed(open("your_page.txt").read())
competitors = [embed(open(f"comp_{i}.txt").read()) for i in range(1, 11)]

igs = 1 - max(cosine(your_page, c) for c in competitors)
print(f"IGS: {igs:.3f}")
That is the entire script. Drop it in a notebook, point it at the right text files, and you have an IGS score. The same pattern works with any embedding provider by swapping the embed function: voyageai for Voyage, sentence_transformers.SentenceTransformer for self-hosted models, FlagEmbedding for BGE.
Approach 3: The Production Pipeline
For teams scoring at scale (1,000+ pages re-scored on a quarterly cadence), a production pipeline is worth building. The shape we use at Searchbloom:
- Crawl the priority page and the top 10 SERP results for the target query (we use the Ahrefs API to pull the SERP and a custom crawler to fetch HTML).
- Extract the visible text from each page (boilerplate-stripped: headers, navigation, and footers removed; main content area only).
- Chunk if necessary for long pages exceeding the embedding model's input window. Most current embedding models accept 8,000 to 32,000 input tokens, which covers nearly all blog content. For longer pages, chunk by H2 section and average the embeddings.
- Compute embeddings via the chosen API (text-embedding-3-large by default).
- Compute IGS for the priority page against the 10 SERP results.
- Store the score in a tracking table with a timestamp, the embedding model used, and the SERP snapshot date. This matters for drift tracking (next section).
- Map the score to a letter grade via the 13-tier scale (F to A+), then to a publish/revise/publish decision.
The pipeline is roughly 200 lines of Python with appropriate error handling. The Searchbloom version uses Modal for the embedding inference, BigQuery for storage, and a small Streamlit dashboard for editorial review. The architecture is unimportant; what matters is that the pipeline runs without manual intervention and that scores are stored over time so drift becomes visible.
The 13-Grade Letter Scale in Practice
The hub introduces the IGS letter grade scale. The four tiers (Absorbed, Modest, Meaningful, Substantial) and the 13-grade granularity (F through A+) make IGS scores legible to editorial teams who do not want to think about cosine similarity ranges. This section is about how to use the scale operationally to make publish-or-revise decisions.
The Editorial Rule: Do Not Publish Below B-
The single most useful operational rule is: a priority page should not publish at IGS below 0.50 (B-). Below that threshold, the page either lives in the absorbed tier or the modest tier, both of which are weak citation candidates for AI search. The page may rank conventionally on Google for a while, but it will not earn AI citation share, and conventional rank tends to erode as the SERP saturates with similar content over time.
This rule does not apply to non-priority pages (supporting content, tag pages, archive pages). It applies to the 30 to 100 priority pages per engagement that are targeting queries you need to win. Most editorial workflows publish priority content the moment it is grammatically clean, which is why most editorial workflows produce content in the C tier and watch it get absorbed.
The B-Tier Range: 0.50 to 0.65 (B- to B+)
This is the "meaningful but not dominant" range. The page is a credible citation candidate but loses to higher-authority duplicates and to A-tier pages on the same query. Sites with strong authority (DR 60+ in Ahrefs terms, established topical reputation) can win citations consistently from the B tier because the conventional ranking signals carry. Sites with weaker authority should treat the B tier as a stop on the way to A- rather than a destination.
The decision logic: publish at B-; verify ranking and citation outcomes after 30 days; if the page is not earning citation share, push to A-.
The A-Tier Range: 0.65 to 0.85 (A- to A)
This is the reliable-citation range. Pages here earn AI citation slots consistently when topical relevance holds, and they do so even from sites without elite domain authority. Most Searchbloom priority pages target the A- threshold (0.65) as the publish target. Above 0.70, the score becomes more about marketing the page (it is genuinely novel content worth promoting) than about defending citation share.
The A+ Tier: 0.85+ (Caution Zone)
At IGS 0.85 and above, the page is so different from the top-10 competitors that topical relevance starts to break. The retrieval layer may struggle to find the page in response to queries that the top-10 ranking pages cover, because the embedding lands so far from the consensus cluster that it falls outside the relevance threshold. We have seen this happen on contrarian pieces written without strong query alignment: the IGS is high, the page is genuinely novel, and yet the citation share is lower than B+ pages on the same topic.
The fix is rarely "make the page less novel." The fix is "increase title-query semantic match and tighten the H2/H3 hierarchy to give the retrieval layer clearer relevance signals while keeping the body novelty intact." High-IGS, high-relevance is the goal. High-IGS, low-relevance is a moat around an empty room.
Calibration: When to Target 0.50, 0.65, or 0.85+
The right target IGS depends on two factors: how saturated the topic is, and how authoritative the publishing site is.
The Calibration Grid
A working approximation we use internally:
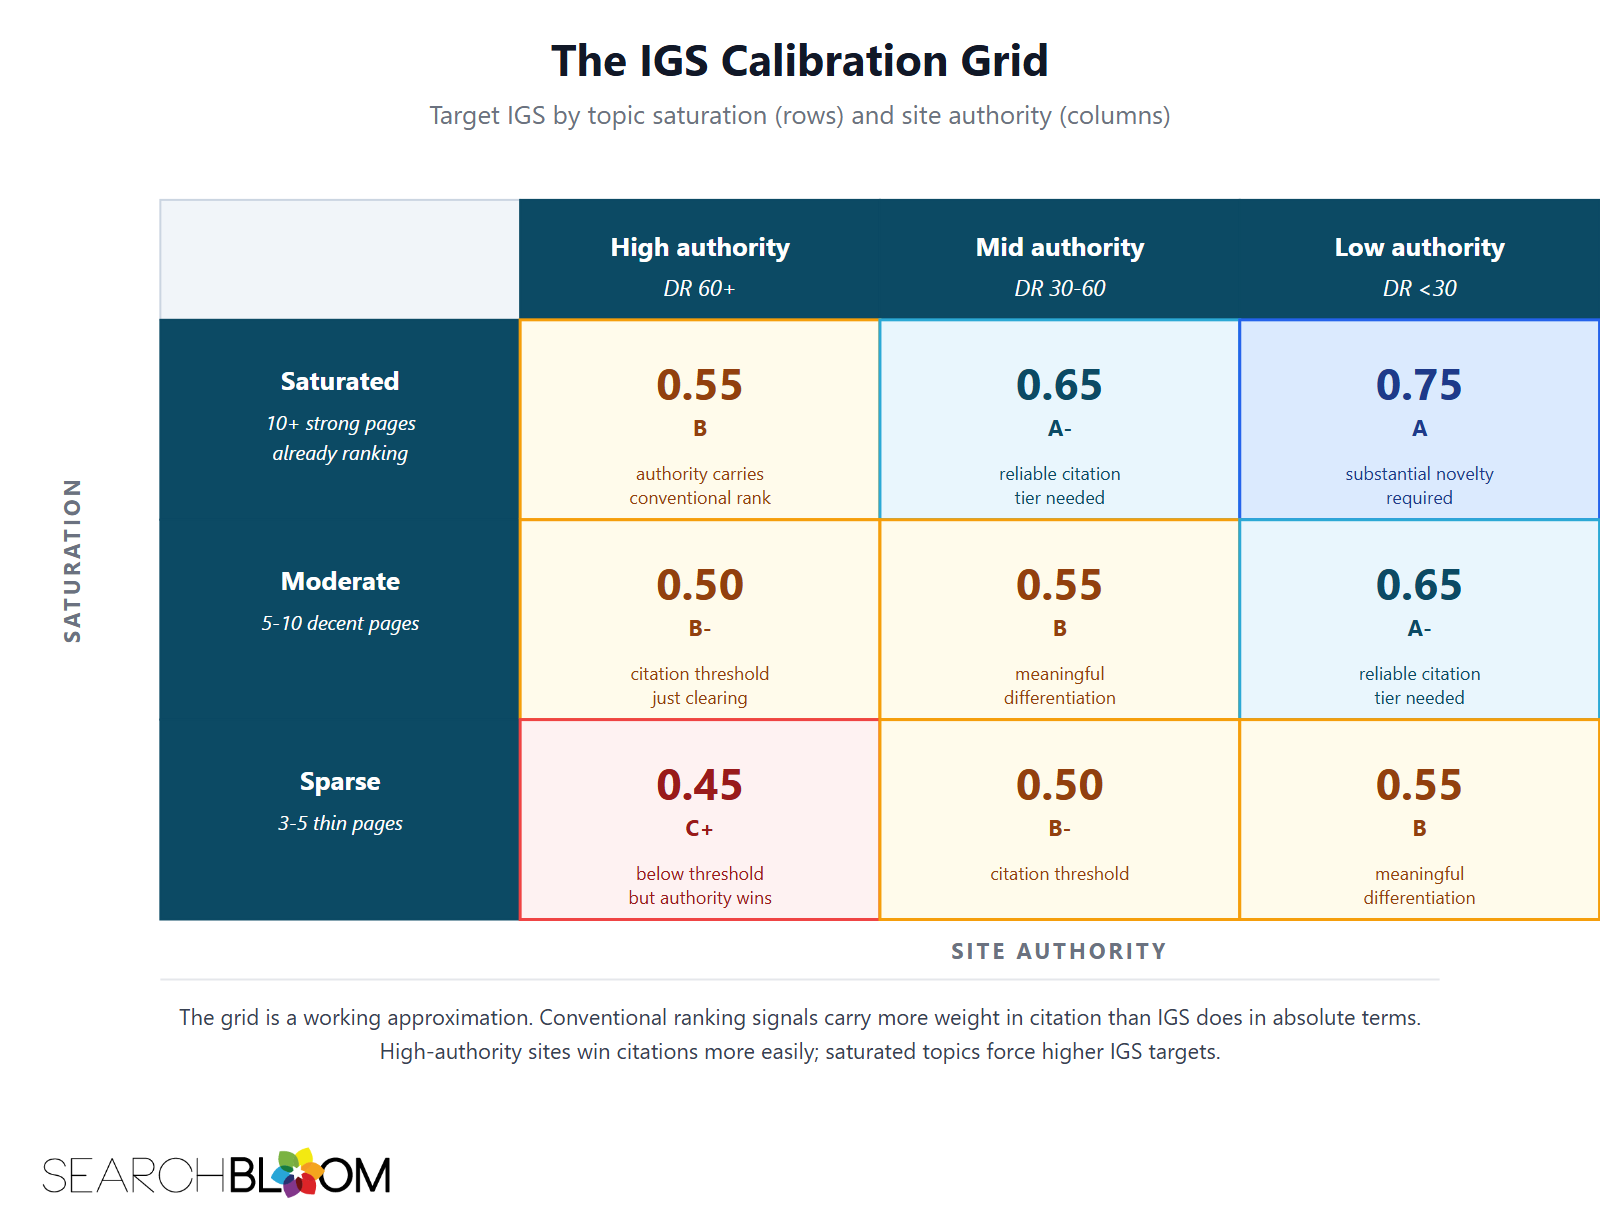
| Saturation Authority | High authority (DR 60+) | Mid authority (DR 30-60) | Low authority (DR <30) |
|---|---|---|---|
| Saturated (10+ strong pages already) | 0.55 (B) | 0.65 (A-) | 0.75 (A) |
| Moderate (5-10 decent pages) | 0.50 (B-) | 0.55 (B) | 0.65 (A-) |
| Sparse (3-5 thin pages) | 0.45 (C+) | 0.50 (B-) | 0.55 (B) |
The grid is a working approximation, not a hard rule. Two principles underneath it. First, conventional ranking signals carry more weight in citation than IGS does in absolute terms (76% of AIO citations in 2025 came from top-10 ranking pages, dropping to 38% in 2026 as fan-out variants gained share). High authority sites win citations more easily because they rank conventionally for the head term and its fan-out variants without needing as much differentiation. Second, saturated topics force higher IGS targets because the consensus cluster is denser and the embedding has to land further out to be retrievable as a distinct option.
How to Read Your Own Position
For a given priority page, look at three signals:
- Domain Rating (DR) or equivalent authority signal. Ahrefs DR, Moz Domain Authority, or Semrush Authority Score. Use whichever your team already monitors.
- SERP saturation. Open the top 10 results for the target query. Read the first 1,000 words of each. If they are saying mostly the same thing, the topic is saturated. If they cover the topic from genuinely different angles, it is moderate. If most are thin or off-topic, it is sparse.
- Your target query's competitiveness. Estimated by keyword difficulty in any standard SEO tool. Saturation correlates with KD but does not equal it; a low-KD topic can be saturated with thin content, and a high-KD topic can be saturated with strong content.
Read those three signals, find your cell in the grid, and use that IGS as the publish target. Most editorial teams pick a target too low because they do not realize how much the conventional signals are doing for them or against them. The grid is a corrective.
Edge Cases Where IGS Misleads
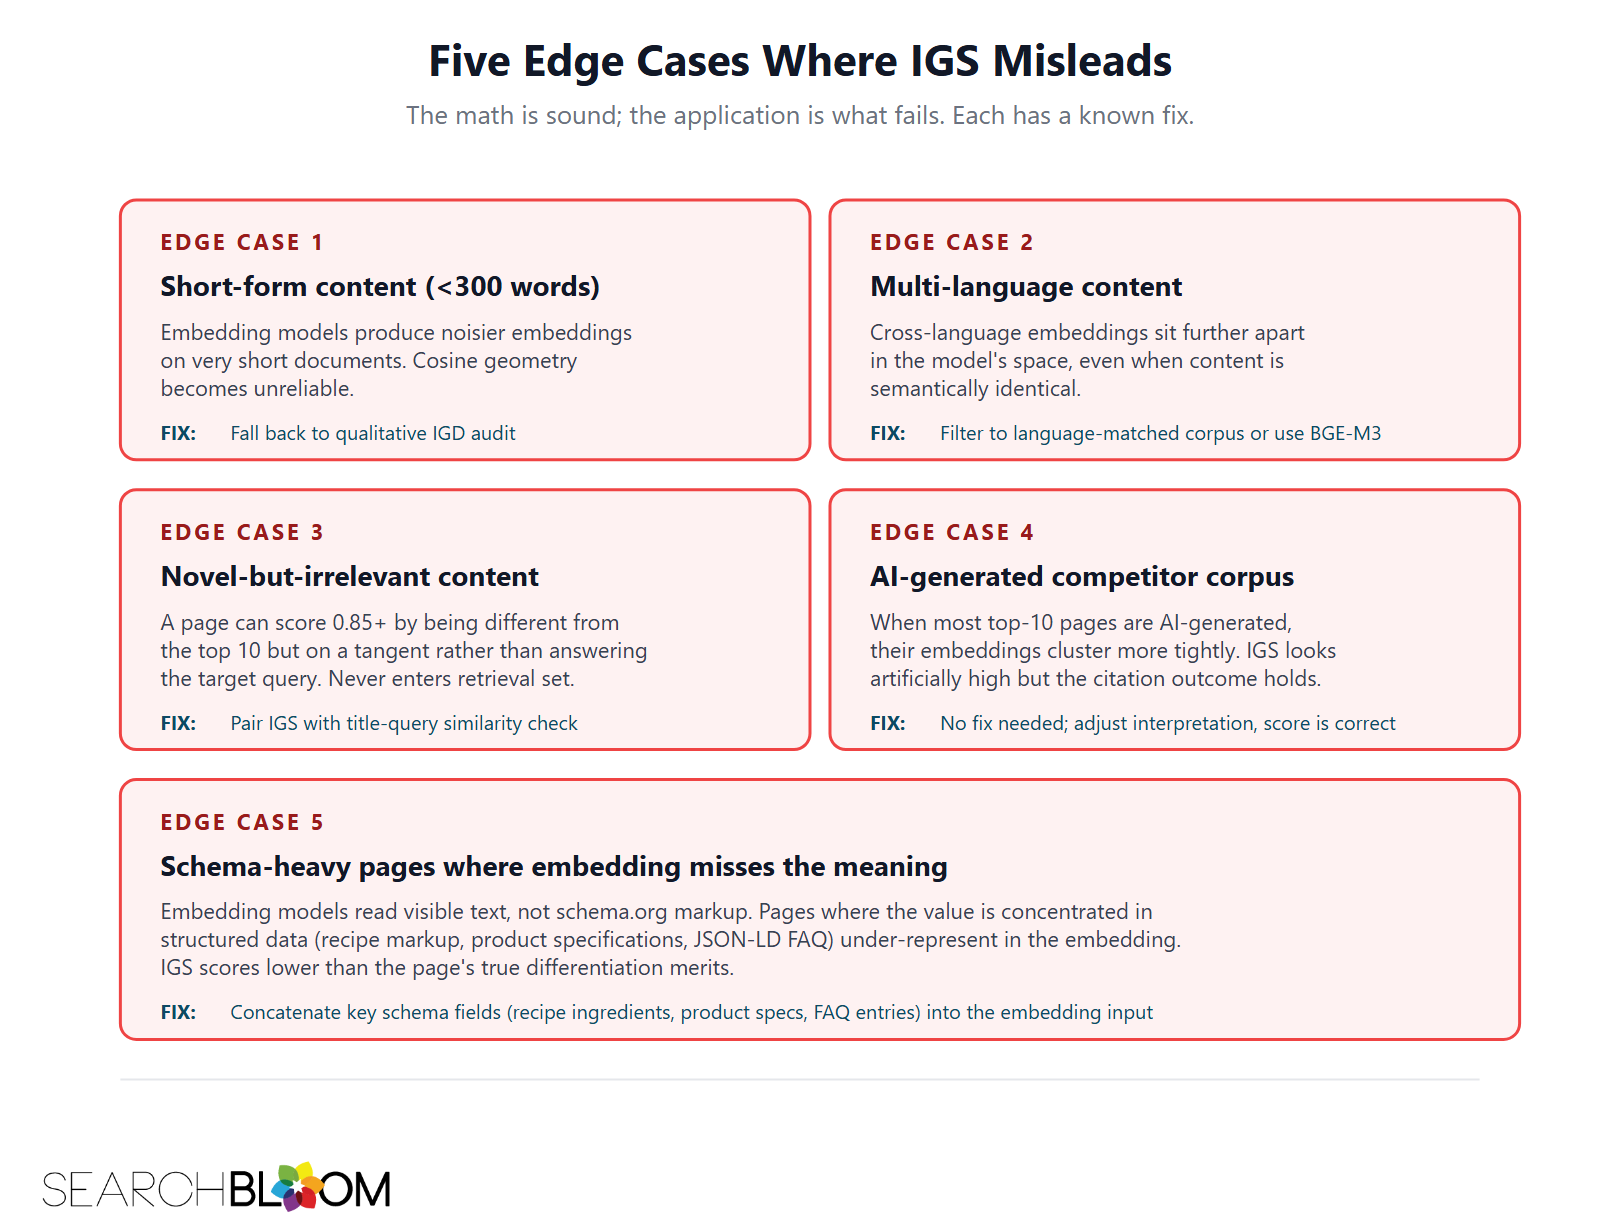
The math is sound. The cases where the score misleads are about what the math is being applied to, not about the math itself. Five named edge cases we have seen consistently.
Edge Case 1: Short-Form Content (Under 300 Words)
Embedding models produce noisier, less stable embeddings on very short documents because the model has fewer tokens to work with and the cosine geometry becomes unreliable. A 200-word page can score IGS 0.65 against the top 10 simply because its embedding lands in a sparse region of the space due to lack of signal, not because it is genuinely differentiated. The fix: do not score short-form content with IGS. For pages under 300 words, fall back to qualitative IGD audit (count distinct insights manually) and ignore the math.
Edge Case 2: Multi-Language Content
If your page is in English and the competitors include non-English pages (or vice versa), the cosine similarity drops mechanically because cross-language embeddings sit further apart in the model's space, even when the content is semantically identical. The fix: filter the SERP to language-matched competitors only before computing IGS, or use a multilingual embedding model (BGE-M3 handles this cleanly) and treat all pages in the corpus as same-language for scoring purposes.
Edge Case 3: Novel-but-Irrelevant Content
A page can score IGS 0.85+ by being genuinely different from the top 10 but on a tangent rather than answering the target query. The retrieval layer at query time will check title-query semantic similarity (0.656 cosine threshold per the Ahrefs ChatGPT data) before considering your page as a citation candidate. A high-IGS page that fails the title-query check never enters the retrieval set in the first place. The fix: always pair IGS scoring with a title-query semantic similarity check. If both clear their thresholds, the page is competitive. If only IGS clears, the page is novel but unreachable.
Edge Case 4: AI-Generated Competitor Corpus
If most of the top-10 competitors are themselves AI-generated content trained on the same underlying public sources, their embeddings cluster more tightly than human-written competitors would. Your IGS against this clustered set looks artificially high (the consensus cluster is denser than it would be otherwise). The retrieval layer is doing the same comparison the math is doing, so the citation outcome reflects reality even if the score feels inflated. No fix needed; the score is correct, just notice that the cluster is unusually tight when you read the SERP and adjust your interpretation accordingly.
Edge Case 5: Schema-Heavy Pages Where Embedding Misses the Meaning
Embedding models read visible text. They do not read schema.org markup. If a page's value is concentrated in structured data (a heavily-schema'd recipe page, a product page where the bulk of the meaning lives in JSON-LD), the embedding under-represents the page's actual content. IGS will score the page lower than its true differentiation merits. The fix: when scoring schema-heavy pages, augment the visible text with key schema fields concatenated into the embedding input (recipe ingredients, product specifications, FAQ entries) before computing the score. The retrieval layer at AI search engines actually does something similar in its indexing pipeline.
Common IGS Calculation Mistakes
Five mistakes we see consistently when teams adopt IGS internally.
Mistake 1: Comparing Against the Wrong Corpus
The corpus must be the top 10 ranking pages for the actual target query, not the top 10 pages on your topic generally, not pages your editor thinks are competitive, and not pages from a year-old SERP screenshot. Pull the SERP fresh for every score. Competitors update their pages, new entrants appear, and the saturation set drifts continuously. A score against a stale corpus is a score against a corpus that does not exist anymore.
Mistake 2: Embedding the Wrong Segments
Most pages have boilerplate (navigation, footers, sidebars, related-posts widgets) that is identical across all pages on the same site and across competitor sites in the same vertical. Embedding the full HTML drowns the actual content signal in boilerplate noise, and the resulting cosine similarities become artificially high (because the boilerplate matches). Strip to main content area only before computing embeddings. Most modern crawlers (Trafilatura, Readability) do this automatically; skipping the step is a common mistake.
Mistake 3: Including Non-Ranking Pages in the Corpus
The corpus is the top 10 ranking pages, not the top 10 most-popular pages, not the top 10 pages your team is aware of, and not the top 10 pages from a related query. The retrieval layer at AI search engines compares your page against pages that are actually retrievable for the query. Including non-ranking pages in the corpus produces a score that is not predictive of citation behavior.
Mistake 4: Misinterpreting Low Scores
A low IGS does not always mean "your content is unoriginal." It can mean "your content is structurally similar to competitors even if substantively different," which usually points to a structural fix (passage-level architecture, heading hierarchy, distinctive section openings) rather than a content rewrite. Before rewriting based on a low IGS, do a manual IGD audit to verify whether the issue is substance or structure. The two fixes are very different.
Mistake 5: Treating IGS as a One-Time Score
A page's IGS at publish time and its IGS six months later are not the same number. Competitors update their pages, new entrants appear, and your page's relative differentiation drifts. We re-score priority pages quarterly and have seen scores drop 0.10 to 0.20 in a single quarter when a major competitor publishes a strong piece on the same query. The score is not a publish gate that runs once. It is a measurement that needs to be tracked.
Tracking IGS Over Time
The measurement infrastructure is the difference between IGS as a one-time editorial check and IGS as a working part of the content operations stack.
The Tracking Cadence
Quarterly re-scoring on priority pages is the right default for most engagements. Monthly is overkill on stable topics and adds noise from SERP volatility. Annual is too slow; the saturation set drifts faster than that. Quarterly catches the meaningful shifts while staying tractable.
What to Store
For each priority page, the tracking table holds:
- Page URL and target query
- Score timestamp
- Embedding model used (so scores from different models do not get mixed)
- SERP snapshot (which 10 competitor URLs)
- Raw cosine similarities to each competitor
- Final IGS score and letter grade
- Action taken (publish, revise, monitor)
The reason to store the raw cosine similarities, not just the final score, is that the closest-match competitor often changes between scoring rounds. Knowing which competitor is currently your closest match tells you who you are actually competing with, which informs the substance of any revision.
What to Watch For
Three patterns matter. First, scores trending down across multiple priority pages on the same topic cluster usually mean a competitor has published a strong piece that is shifting the saturation set. Pull the SERP and read the new entrant. Second, scores trending down on a single page while peers on the same topic cluster hold steady usually mean your page has aged poorly (outdated stats, broken examples, references to deprecated tools). Refresh the page. Third, large single-period drops (0.15+) almost always mean a major competitor change. Investigate before responding.
IGS vs. Other Content Scoring Systems
Several established content scoring tools predate IGS in the market: Surfer, Clearscope, MarketMuse, and the various keyword-density and content-grading tools that publish with most enterprise SEO suites. None of them are measuring the same thing IGS measures, and conflating them produces editorial decisions that look right and perform wrong.
vs. Surfer
Surfer's content score measures alignment between a draft and the on-page features of top-ranking competitors: keyword usage, paragraph length, heading structure, term coverage. The score rises when a draft looks more like the existing SERP. IGS measures the opposite: how different the draft is from the existing SERP. The two scores can rise and fall in opposite directions on the same page. A Surfer-100 page often scores IGS in the 0.20 to 0.35 range because it has been actively engineered to match the consensus. A high-IGS page often scores Surfer 60-70 because its differentiation comes from substance the SERP does not have, which Surfer's term-coverage check misses.
The right framing is that Surfer measures retrievability (does the page look like a relevant answer to the query) and IGS measures differentiation (does the page add something the SERP does not have). Both matter. Optimizing only one produces predictable failures.
vs. Clearscope
Clearscope's content grade is similar to Surfer's: keyword and term coverage benchmarked against ranking competitors. The same framing applies. A high Clearscope grade does not predict AI citation share; it predicts conventional ranking eligibility. Use both, target both, do not assume one is a substitute for the other.
vs. MarketMuse
MarketMuse's content score adds topic modeling depth (how well the draft covers the semantic space of the topic) on top of term coverage. Closer to retrievability than to differentiation, but with a richer signal than Surfer or Clearscope. Still measures something different from IGS. Editorial-led brands often prefer MarketMuse because the topic modeling forces depth; it does not force differentiation.
vs. Keyword-Density Tools
Keyword density is a 2008 metric that has not predicted ranking outcomes for over a decade. The tools that still expose it are exposing a vestigial signal. IGS is not in dialogue with keyword density at all; the underlying mathematics has nothing in common.
The Right Stack
A complete content scoring stack covers three dimensions: retrievability (Surfer or Clearscope or MarketMuse, pick one), differentiation (IGS), and authority signals (links, conventional ranking, technical SEO). Targeting all three together on priority pages is what produces durable AI citation share. Targeting only one produces the predictable failure modes the existing tools were designed to surface.
A Worked Example
A working scoring run, with hypothetical numbers calibrated to what we typically see on partner engagements.
A partner publishes a 4,200-word piece on "best CRM for SaaS startups" targeting a moderate-saturation, moderate-competition query. The site is mid-authority (DR 45). The calibration grid suggests a 0.55 target (B).
Step one, pull the SERP. Top 10 results identified. Boilerplate stripped from each.
Step two, embed each via text-embedding-3-large. Eleven embeddings produced (the page plus 10 competitors).
Step three, compute cosine similarities. Results:
- Competitor 1 (HubSpot blog): 0.71
- Competitor 2 (G2 list page): 0.68
- Competitor 3 (Capterra category): 0.66
- Competitor 4 (Forbes Advisor): 0.62
- Competitor 5 (independent SaaS blog): 0.59
- Competitor 6 (Salesforce blog): 0.55
- Competitor 7 (Pipedrive blog): 0.51
- Competitor 8 (TechCrunch listicle): 0.48
- Competitor 9 (Reddit thread): 0.41
- Competitor 10 (small comparison blog): 0.38
Step four, compute IGS. Max cosine similarity is 0.71 (HubSpot). IGS = 1 - 0.71 = 0.29. Letter grade: F (absorbed tier).
Step five, decide. The score is below the B- publish threshold and well below the calibrated B target. Do not publish. The closest match (HubSpot) tells the editor where the substantive overlap lives; comparing the two pages section by section reveals that the partner page has roughly the same evaluation criteria, the same vendor list, and the same "things to consider" framing as the HubSpot piece.
Step six, revise. The editor adds three named failure modes specific to SaaS startup CRM selection (cohort specificity from Technique 5 of the 12 Information Gain Techniques), publishes pricing transparency on each vendor's actual mid-market range (Technique 6), and inserts a direct quote from a partner's CRO about the migration cost from HubSpot to a smaller alternative (Technique 3). The revision adds roughly 800 words.
Step seven, re-score. New IGS: 0.58. Letter grade: B. Above the calibrated target. Publish.
Step eight, monitor. Re-score quarterly. Track citation share via Peec AI and AI Overview presence via the Searchbloom monitoring stack. Adjust if the score drifts down.
That is the operational loop. The math is mechanical. The editorial discipline (refusing to publish at F, identifying the substantive overlap, choosing the right techniques to apply) is where the work lives.
Questions and Answers
What is the Information Gain Score (IGS)?
The Information Gain Score is the mathematical measure of how differentiated a piece of content is from the top-ranking pages for the same query. The formula is IGS = 1 minus the maximum cosine similarity between your document's vector embedding and each top-ranking competitor's vector embedding. The result is a number between 0 and 1; higher means more differentiated. A score above 0.50 (B- on the 13-grade letter scale) is the practical citation threshold for AI search.
Which embedding model should I use to compute IGS?
For most teams, text-embedding-3-large from OpenAI is the right default: highest quality on standard benchmarks, $0.13 per 1M tokens, three-line integration. Switch to voyage-3 if cost matters at scale (it is roughly half the price). Switch to self-hosted BGE-M3 if you have ML infrastructure and need data residency or multilingual support. Skip BERT and pre-2023 transformers entirely.
How much does it cost to compute IGS?
For a single priority page with 10 competitors using text-embedding-3-large, the cost is approximately $0.001 per scoring run (at $0.13/1M input tokens, with each page averaging 1,500 tokens). For 100 priority pages re-scored quarterly, total annual cost is approximately $0.40. Cost is not a meaningful constraint at the priority-page-list scale; it only matters when scoring 10,000+ pages.
Can I compute IGS without code?
Yes. The spreadsheet approach uses SUMPRODUCT and SQRT formulas in Google Sheets or Excel to compute cosine similarity, with embeddings produced separately (via API call, notebook, or AI assistant) and pasted in. Practical for five to ten priority pages per quarter. Beyond that, automate with Python.
Why is the citation threshold at 0.50 specifically?
The threshold is empirical, derived from auditing the IGS scores of pages that won AI Overview citation slots versus pages that got absorbed into AI synthesis without attribution. Pages winning citations consistently scored above 0.50; pages losing scored below. The threshold is where the citation outcome bifurcates clearly across the partner pages we have measured. Different topical domains may have slightly different empirical thresholds, but 0.50 holds as a working default across the verticals we have tested.
Why does the formula use max instead of mean across competitors?
Because one near-duplicate competitor sinks your citation odds even if the other nine are very different. The retrieval layer at AI search engines picks the most similar candidate first, then the most differentiated. If your closest competitor is at 0.78 cosine similarity, the retrieval layer effectively treats you as a duplicate of that competitor, regardless of how different you are from the rest. Max captures this asymmetry; mean smooths it out and gives a falsely high score.
How often should I re-score my priority pages?
Quarterly is the right default. Competitors update their pages, new entrants appear, and the saturation set drifts. Monthly re-scoring adds noise from SERP volatility without catching meaningful shifts faster. Annual re-scoring is too slow; we have seen scores drop 0.15+ in a single quarter when a major competitor publishes a strong piece on the same query.
Does IGS work for short-form content?
Not reliably. Embedding models produce noisier embeddings on documents under roughly 300 words, which makes the cosine geometry unreliable. For short-form content, fall back to a qualitative Information Gain Density audit (count distinct insights manually) rather than computing IGS.
Does IGS work for non-English content?
Yes, but use a multilingual embedding model (BGE-M3 is the leading option) and ensure your competitor corpus is language-matched to your page. Cross-language cosine similarities are mechanically lower because cross-language embeddings sit further apart in the model's space, which produces falsely high IGS scores if the corpus is mixed-language.
How is IGS different from Surfer's content score or Clearscope's grade?
Surfer and Clearscope measure how similar your draft is to the top-ranking competitors on a set of on-page features (keyword usage, term coverage, paragraph structure). IGS measures the opposite: how different your draft is from the competitors in vector space. The two scores can move in opposite directions on the same page. Surfer measures retrievability; IGS measures differentiation. Both matter; they are not substitutes.
Can I aim for IGS above 0.85?
Possible but risky. At very high IGS, the page's embedding lands so far from the consensus cluster that topical relevance can break, meaning the retrieval layer struggles to find the page in response to queries the consensus pages cover. The fix is rarely to make the page less novel; it is to tighten title-query alignment and heading hierarchy to give the retrieval layer clearer relevance signals while keeping the body novelty intact.
Where does IGS fit inside the MERIT Framework?
IGS is the math behind the differentiation signal that flows through the MERIT Framework. The framework's Evidence pillar is where you author the Information Gain Density that IGS measures. The Relevance pillar is where structural changes shift the embedding to produce a higher IGS. The Inclusion pillar is what makes the resulting IGS reachable to AI engines via crawl and index. The Transformation pillar is where IGS gets re-scored quarterly and tracked over time. IGS is the measurement instrument; MERIT is the operating system around it.
The Bottom Line
The Information Gain Score is the math that operationalizes Information Gain Density into a single editorial number. The formula is one line. The discipline that makes it useful is in the surrounding choices: which embedding model, which competitor corpus, which segments to embed, which letter grade to publish at, when to re-score, and which edge cases will mislead the math if you let them.
Most teams that adopt IGS get the formula right and the discipline wrong. They use a default embedding model without thinking about it, score against a stale corpus, publish at a B- on a saturated topic that needed an A-, and never re-score. The result is a metric that produces a number every quarter and does not change editorial outcomes. The metric is not the work. The work is in the calibration grid, the refusal to publish below threshold, the quarterly re-scoring rhythm, and the editorial muscle to act on the score when it tells you to revise. IGS is what makes that muscle measurable.
Information gain is one of six components of Corpus Engineering, the systems-level discipline for AI visibility. The other five are corpus accessibility, semantic structure, corpus expansion, retrieval optimization, and corpus maintenance.
